
【深度学习】实现DETR模型预测+保存每个图片中的检测框的txt文件+代码
DETR模型实现使用自己训练的权重进行预测+预测整个文件夹的图片+保存画好框的图片+保存每个图片的标注框相应信息的txt文件。以及实现过程中遇到的bug+tips
由于网上关于DETR模型的笔记以及记录蛮少的,故在此贴一下我跑通预测代码以及保存相应的txt文件的代码以及过程
文章目录
前言
DETR模型跑通基本参考此篇文章:【DETR】训练自己的数据集-实践笔记
此处不再进行DETR模型跑通+训练的赘述ps:DETR模型本来是跟着这篇文章进行预测的,但是在我自己的数据集上预测的效果太差了,故重新搜集了新的预测代码
此处贴一个DETR模型的源代码:https://github.com/facebookresearch/detr
一. 预测代码(GPU)
此处的预测代码主要参考此篇文章中的预测部分,而且个人觉得这篇文章解读得可以:DEtection TRansformer 实现目标检测[Pytorch1.5+ & Torchvision0.6+]
ps:上面这篇文章用的是下载的预训练权重,并不是自己训练的权重,所以我结合了另一篇文章(使用的是自己训练的权重,但是使用的是CPU,后面第二部分会贴出)
其中预测整个文件夹的图片以及保存预测完后的图片以及保存txt结果都是自己改的代码,可能不保证完全正确(我这边运行起来是没问题的)
1.1 代码:
import math
import os.path
from PIL import Image
import requests
import matplotlib.pyplot as plt
import torch
from torch import nn
from torchvision.models import resnet50
import torchvision.transforms as T
from hubconf import *
from util.misc import nested_tensor_from_tensor_list
torch.set_grad_enabled(False)
# 输入自己的数据集的类别
CLASSES = [
'N/A', 'xxx', 'xxx', 'xxx'
]
# colors for visualization
COLORS = [
[0.000, 0.447, 0.741],
[0.850, 0.325, 0.098],
[0.929, 0.694, 0.125],
[0.494, 0.184, 0.556],
[0.466, 0.674, 0.188],
[0.301, 0.745, 0.933]
]
# standard PyTorch mean-std input image normalization
transform = T.Compose([
T.Resize(800),
T.ToTensor(),
T.Normalize([0.485, 0.456, 0.406],
[0.229, 0.224, 0.225])
])
# for output bounding box post-processing
def box_cxcywh_to_xyxy(x):
x_c, y_c, w, h = x.unbind(1)
b = [(x_c - 0.5 * w), (y_c - 0.5 * h),
(x_c + 0.5 * w), (y_c + 0.5 * h)]
return torch.stack(b, dim=1)
def rescale_bboxes(out_bbox, width, height):
# img_w, img_h = size
# b = box_cxcywh_to_xyxy(out_bbox)
box_coords = box_cxcywh_to_xyxy(out_bbox)
scale_tensor = torch.Tensor(
[width, height, width, height]).to(
torch.cuda.current_device()
)
return box_coords * scale_tensor
def plot_results(pil_img, prob, boxes, image_item):
#保存图片和labels文件夹的目录
save_dir = '/home/exp1'
#保存画框后的图片目录
save_img_path = os.path.join(save_dir, image_item)
#labels文件夹目录
save_txt_dir = '/home/exp1/labels'
plt.figure(figsize=(16, 10))
plt.imshow(pil_img)
ax = plt.gca()
colors = COLORS * 100
for p, (xmin, ymin, xmax, ymax), c in zip(prob, boxes.tolist(), colors):
ax.add_patch(plt.Rectangle((xmin, ymin), xmax - xmin, ymax - ymin,
fill=False, color=c, linewidth=3))
cl = p.argmax()
text = f'{CLASSES[cl]}: {p[cl]:0.2f}'
#获取每个图片相应的txt文件的名字
#如xxx.jpg,此处txt_id为xxx
txt_id = image_item[:-4]
#获取每个txt的绝对路径 /home/exp1/xxx.txt
filename = os.path.join(save_txt_dir, f"{txt_id}.txt")
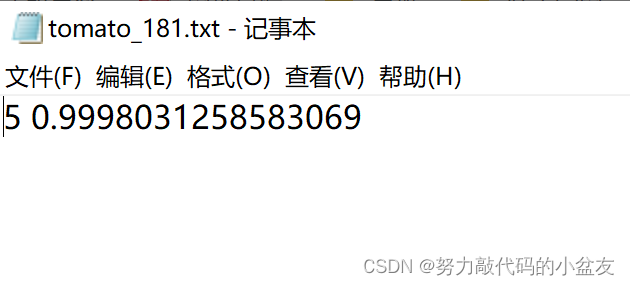
with open(filename, "a", encoding="utf-8") as f:
#此处我只需要保存预测类别的序号和概率即可,
#所以保存在txt文件里为cl-1即可,
#-1是因为我这里不需要N/A这个类别的序号
results = f"{cl-1} {p[cl]} \n"
f.writelines(results)
ax.text(xmin, ymin, text, fontsize=15,
bbox=dict(facecolor='yellow', alpha=0.5))
plt.axis('off')
# 保存画好的图片
plt.savefig(save_img_path, format='jpeg')
plt.close("all")
def detect(im, model, transform):
device = torch.cuda.current_device()
width = im.size[0]
height = im.size[1]
# mean-std normalize the input image (batch-size: 1)
img = transform(im).unsqueeze(0)
img = img.to(device)
# propagate through the model
outputs = model(img)
# keep only predictions with 0.7+ confidence
probas = outputs['pred_logits'].softmax(-1)[0, :, :-1]
keep = probas.max(-1).values > 0.25
# convert boxes from [0; 1] to image scales
bboxes_scaled = rescale_bboxes(outputs['pred_boxes'][0, keep], width, height)
return probas[keep], bboxes_scaled
if __name__ == "__main__":
device = torch.device('cuda:0')
# 这里与前面的num_classes数值相同,就是最大的category id值 + 1
# 我有11类,故这里我填的12
model = detr_resnet50(False, 12)
# 自己已经训练好的权重 因为使用GPU所以map_location后面跟cuda
state_dict = torch.load(r"/home/detr-main/outputs/train/exp4/checkpoint.pth", map_location='cuda')
model.load_state_dict(state_dict["model"])
model.to(device)
model.eval()
# 要预测的图片文件夹
image_file_path = os.listdir("/home/detr-main/own_datas_coco/test2017")
# 循环读入每一张图片
for image_item in image_file_path:
image_path = os.path.join("/home/detr-main/own_datas_coco/test2017", image_item)
im = Image.open(image_path)
scores, boxes = detect(im, model, transform)
plot_results(im, scores, boxes, image_item)
1.2 效果
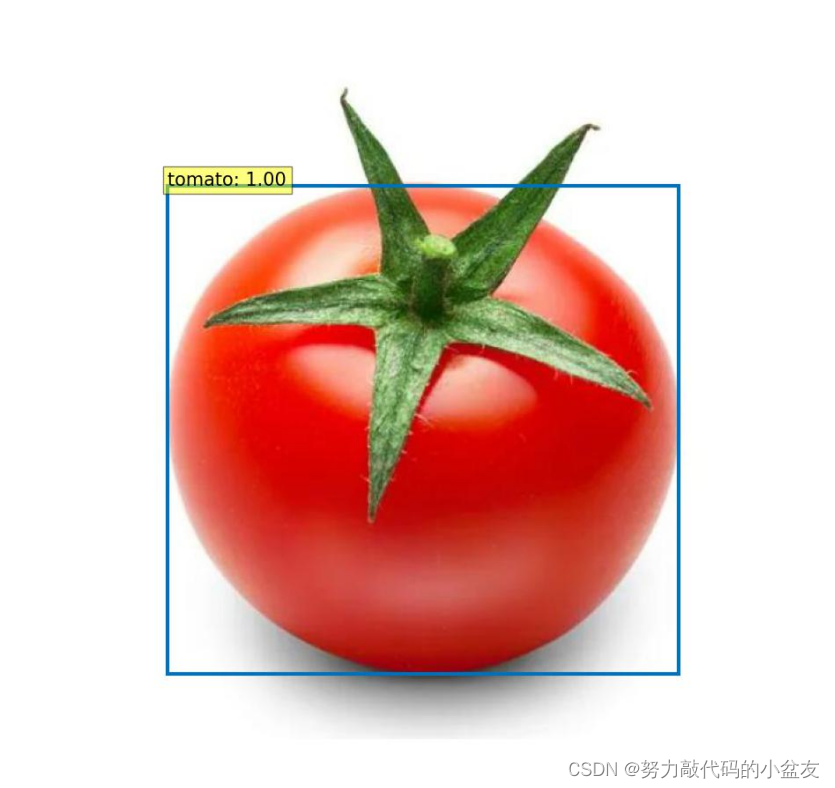
二.预测代码(CPU)
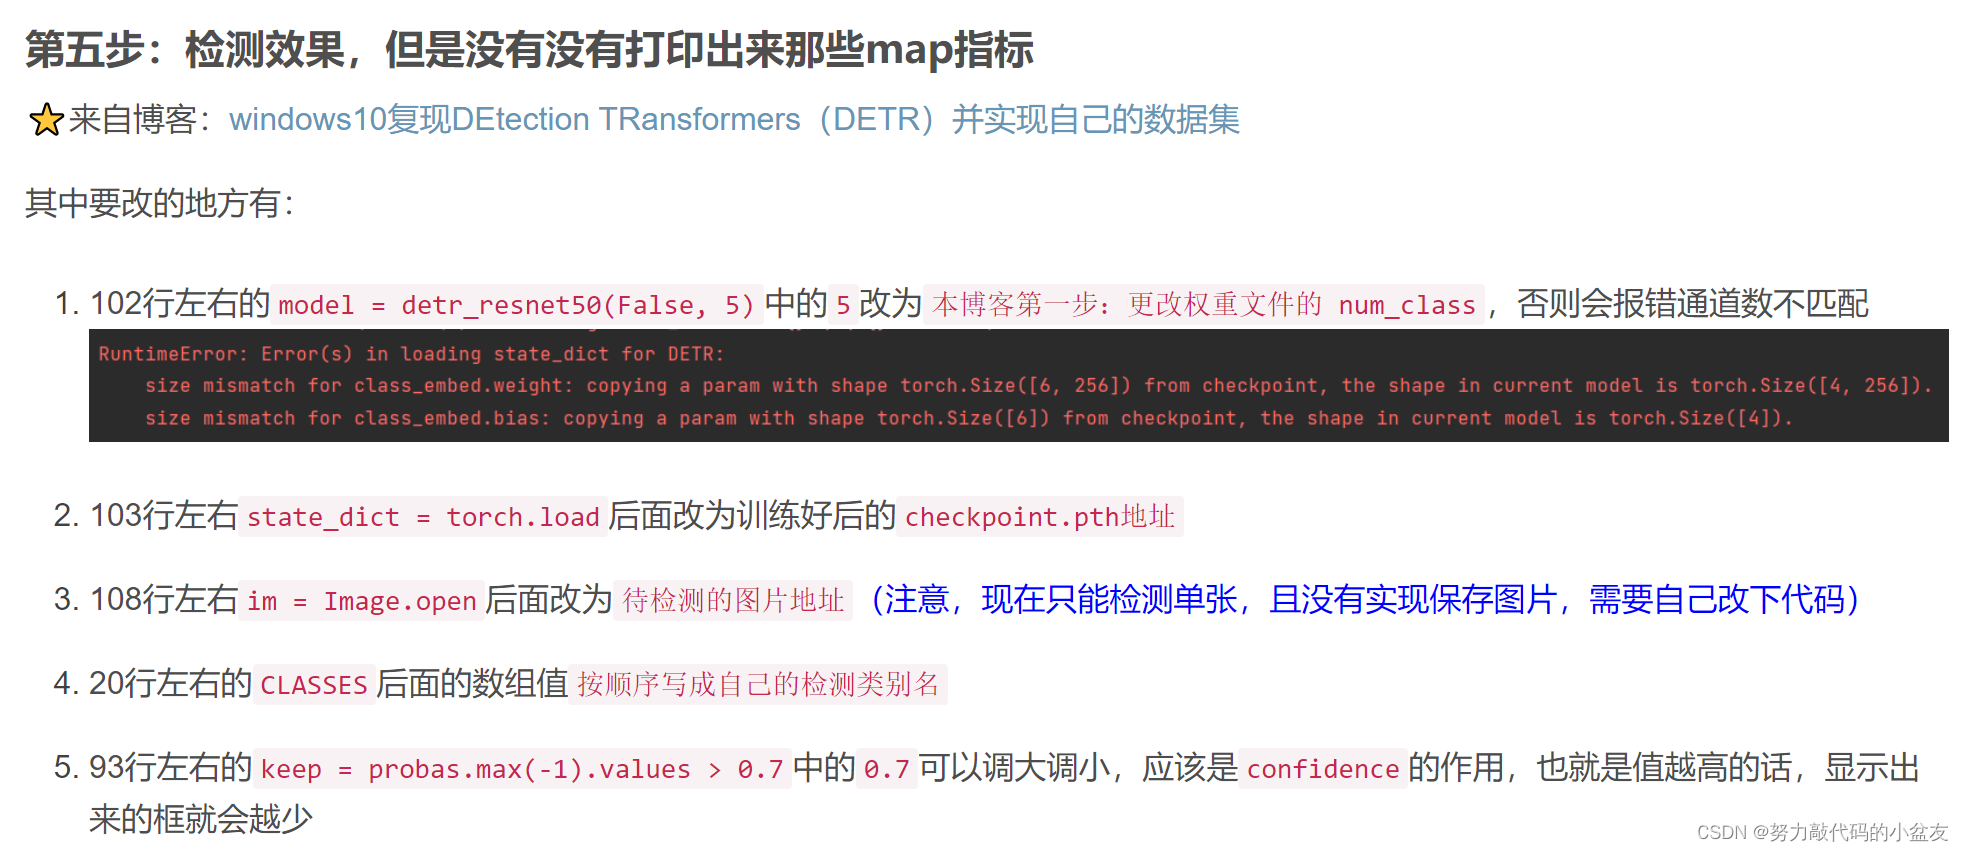
此处参考的这篇文章的第五步:DETR训练自己的数据集
还有这篇文章:https://www.ai2news.com/blog/3080436/
import math

from PIL import Image
import requests
import matplotlib.pyplot as plt

# import ipywidgets as widgets
# from IPython.display import display, clear_output

import torch
from torch import nn
from torchvision.models import resnet50
import torchvision.transforms as T
from hubconf import *
from util.misc import nested_tensor_from_tensor_list

torch.set_grad_enabled(False)

# COCO classes
CLASSES = [
    'D00', 'D10', 'D20', 'D40'
]

# colors for visualization
COLORS = [[0.000, 0.447, 0.741], [0.850, 0.325, 0.098]]

# standard PyTorch mean-std input image normalization
transform = T.Compose([
    T.Resize(800),
    T.ToTensor(),
    T.Normalize([0.485, 0.456, 0.406], [0.229, 0.224, 0.225])
])


# for output bounding box post-processing
def box_cxcywh_to_xyxy(x):
    x_c, y_c, w, h = x.unbind(1)
    b = [(x_c - 0.5 * w), (y_c - 0.5 * h),
         (x_c + 0.5 * w), (y_c + 0.5 * h)]
    return torch.stack(b, dim=1)


def rescale_bboxes(out_bbox, size):
    img_w, img_h = size
    b = box_cxcywh_to_xyxy(out_bbox)
    b = b * torch.tensor([img_w, img_h, img_w, img_h], dtype=torch.float32)
    return b


def plot_results(pil_img, prob, boxes):
    plt.figure(figsize=(16, 10))
    plt.imshow(pil_img)
    ax = plt.gca()
    colors = COLORS * 100
    for p, (xmin, ymin, xmax, ymax), c in zip(prob, boxes.tolist(), colors):
        ax.add_patch(plt.Rectangle((xmin, ymin), xmax - xmin, ymax - ymin,
                                   fill=False, color=c, linewidth=3))
        cl = p.argmax()
        text = f'{CLASSES[cl]}: {p[cl]:0.2f}'
        ax.text(xmin, ymin, text, fontsize=15,
                bbox=dict(facecolor='yellow', alpha=0.5))
    plt.axis('off')
    plt.show()


def detect(im, model, transform):
    # mean-std normalize the input image (batch-size: 1)
    img = transform(im).unsqueeze(0)

    # propagate through the model
    outputs = model(img)

    # keep only predictions with 0.7+ confidence
    probas = outputs['pred_logits'].softmax(-1)[0, :, :-1]
    keep = probas.max(-1).values > 0.00001

    # convert boxes from [0; 1] to image scales
    bboxes_scaled = rescale_bboxes(outputs['pred_boxes'][0, keep], im.size)
    return probas[keep], bboxes_scaled


def predict(im, model, transform):
    # mean-std normalize the input image (batch-size: 1)
    anImg = transform(im)
    data = nested_tensor_from_tensor_list([anImg])

    # propagate through the model
    outputs = model(data)

    # keep only predictions with 0.7+ confidence
    probas = outputs['pred_logits'].softmax(-1)[0, :, :-1]

    keep = probas.max(-1).values > 0.7  # 0.7 好像是调整置信度的
    # print(probas[keep])

    # convert boxes from [0; 1] to image scales
    bboxes_scaled = rescale_bboxes(outputs['pred_boxes'][0, keep], im.size)
    return probas[keep], bboxes_scaled


if __name__ == "__main__":
    model = detr_resnet50(False, 5) # 这里与前面的num_classes数值相同,就是最大的category id值 + 1
    state_dict = torch.load(r"G:\pycharmprojects\detr-main\output\checkpoint.pth", map_location='cpu')
    model.load_state_dict(state_dict["model"])
    model.eval()

    # im = Image.open('data/coco/train2017/001554.jpg')
    im = Image.open(r'F:\A_Publicdatasets\RDD2022_released_through_CRDDC2022\RDD2022\A_unitedataset\images\val\China_Drone_000038.jpg')

    scores, boxes = predict(im, model, transform)
    plot_results(im, scores, boxes)
三.实现过程中遇到的bug、tips
3.1 RuntimeWarning: More than 20 figures have been opened.
此处参考这篇文:RuntimeWarning: More than 20 figures have been opened.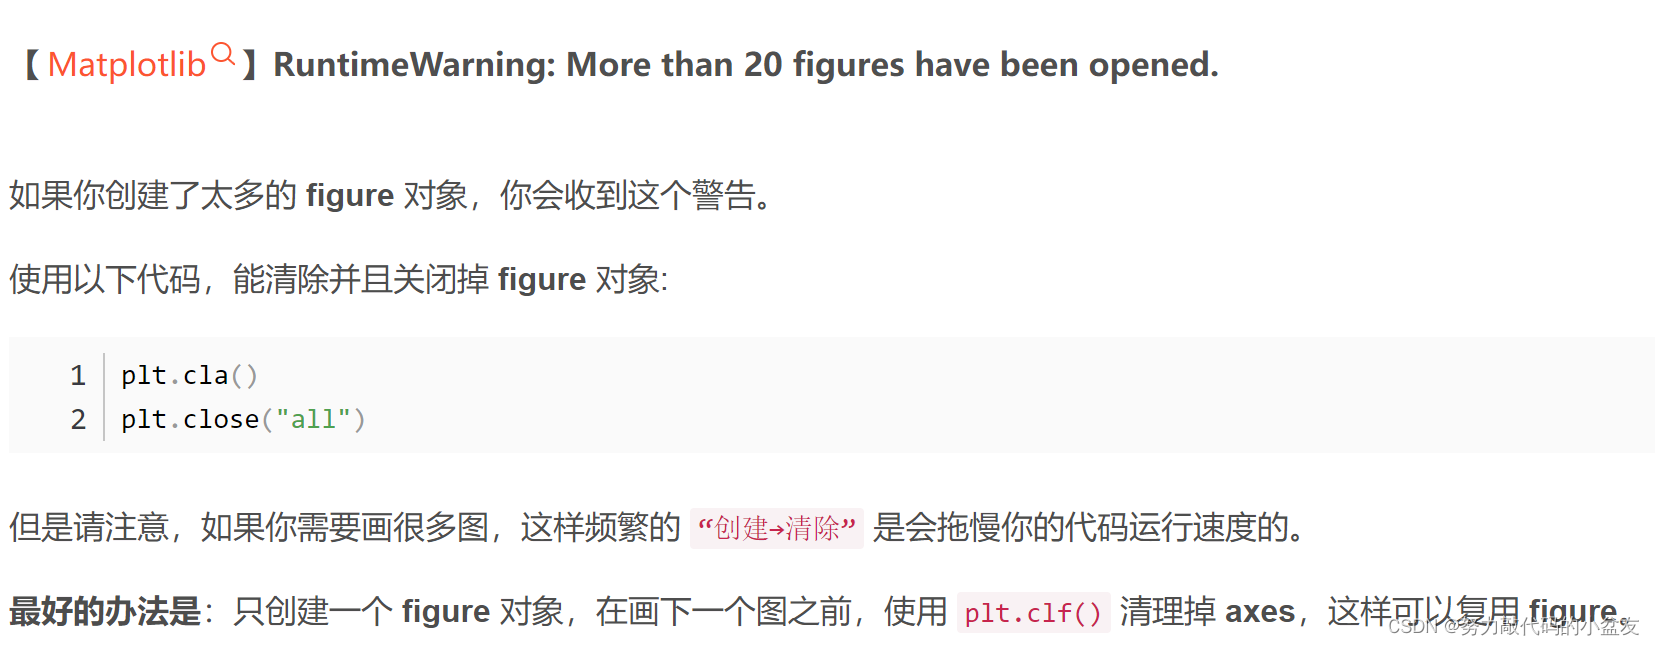
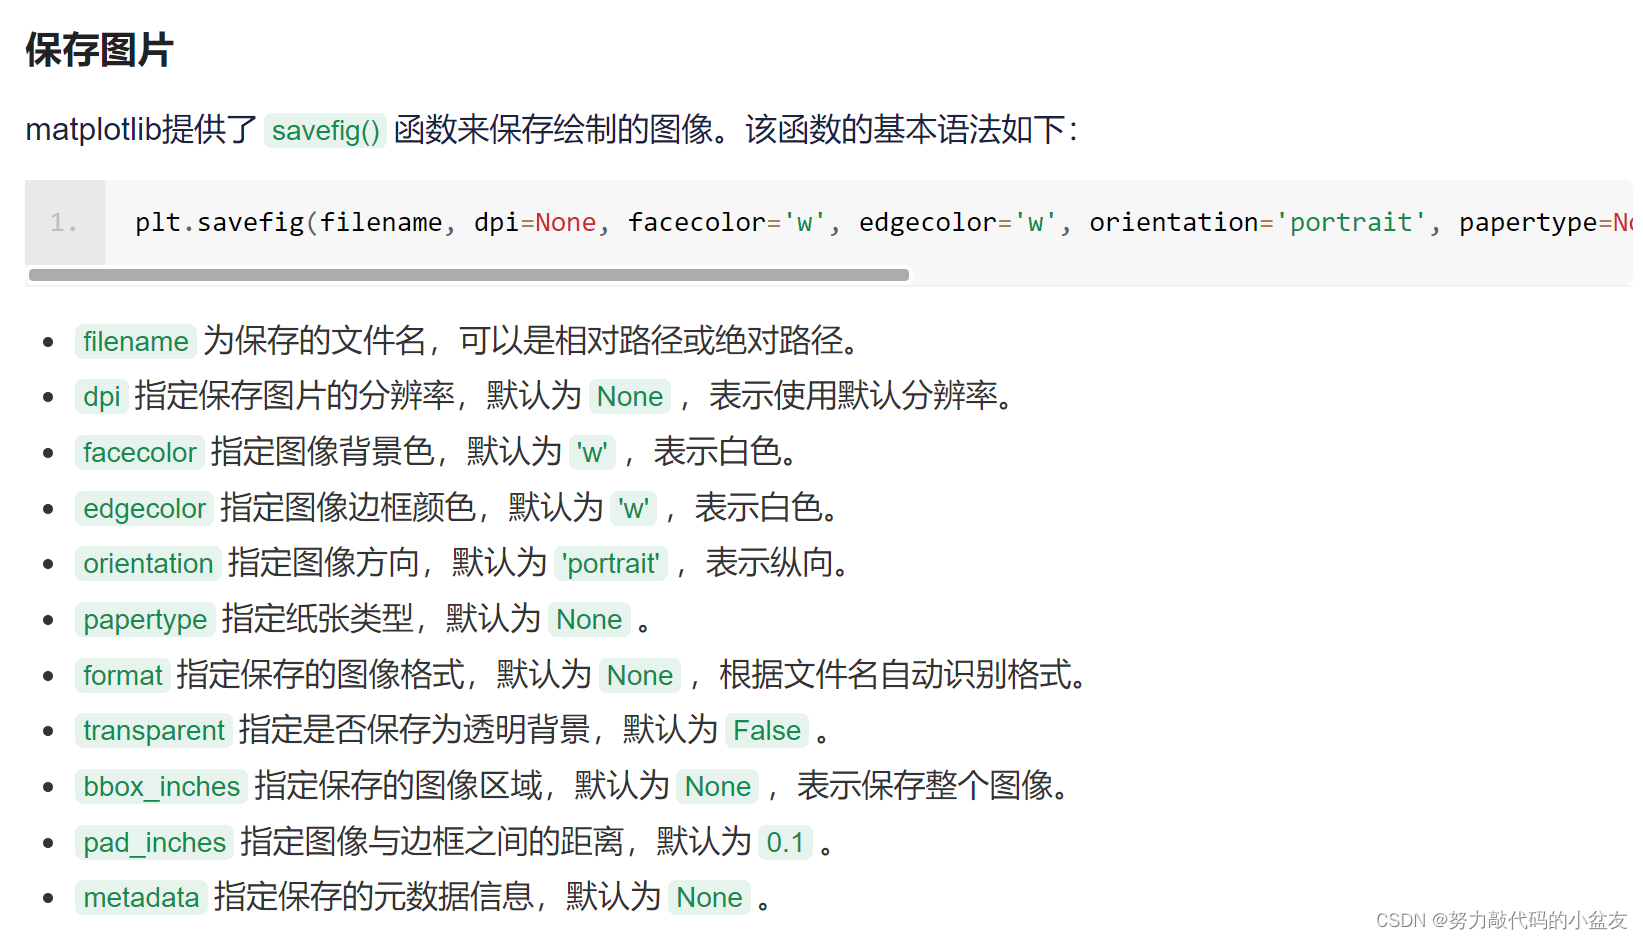
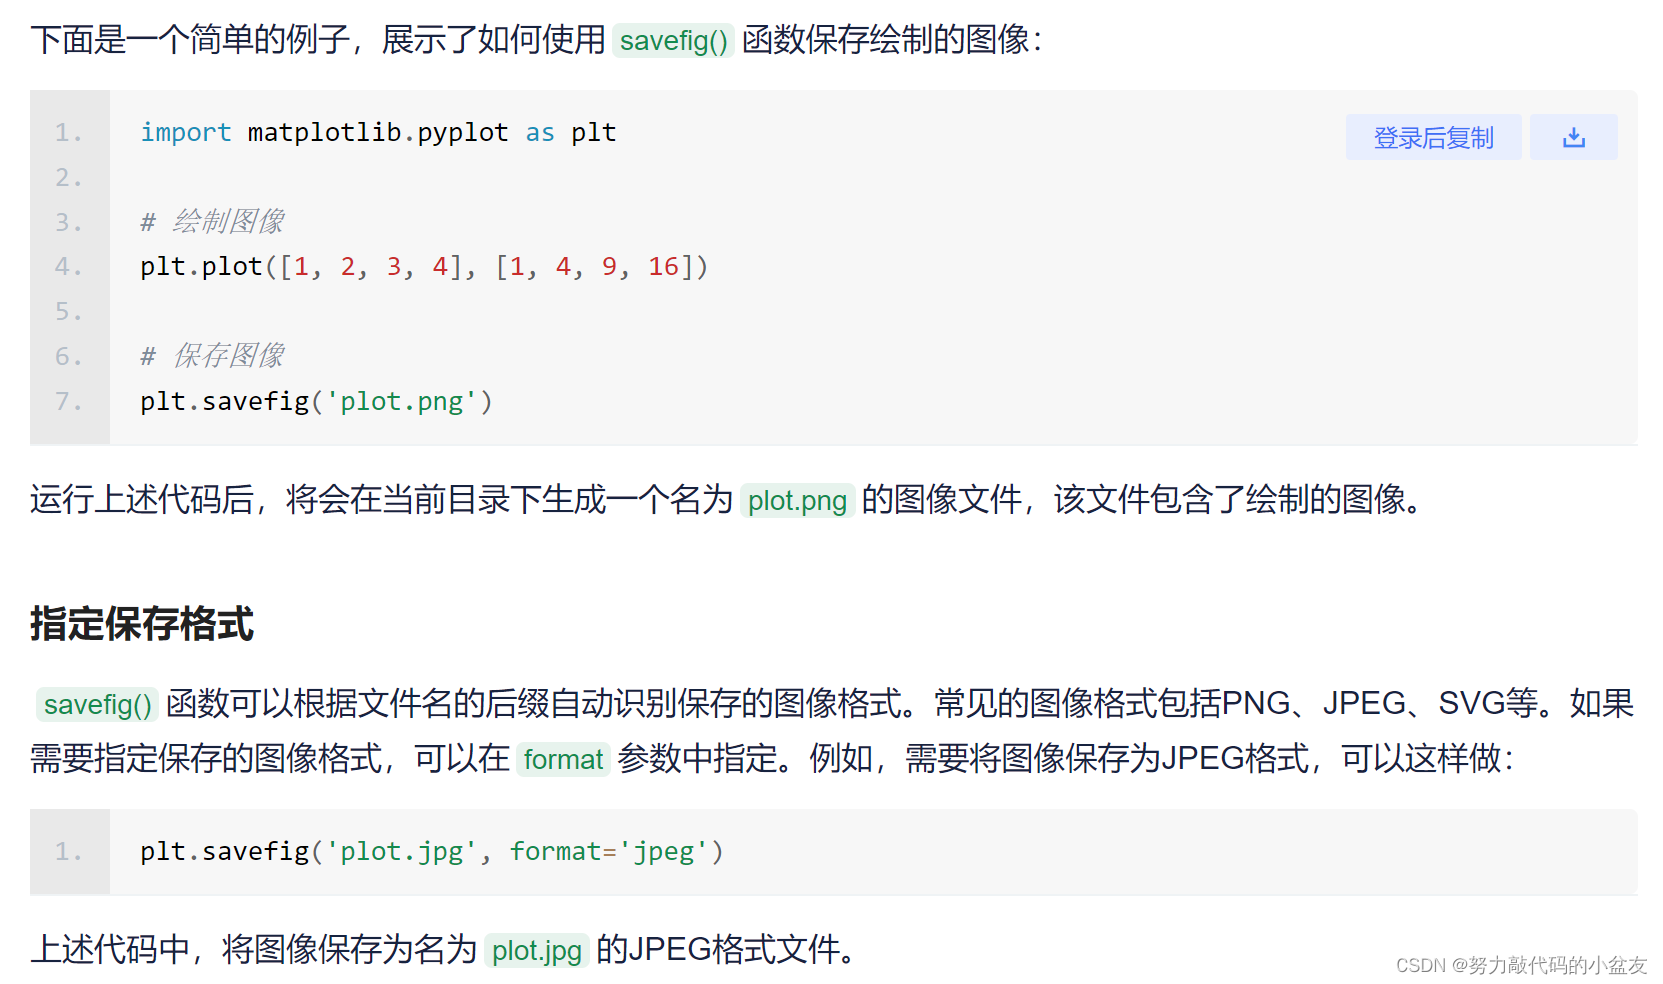
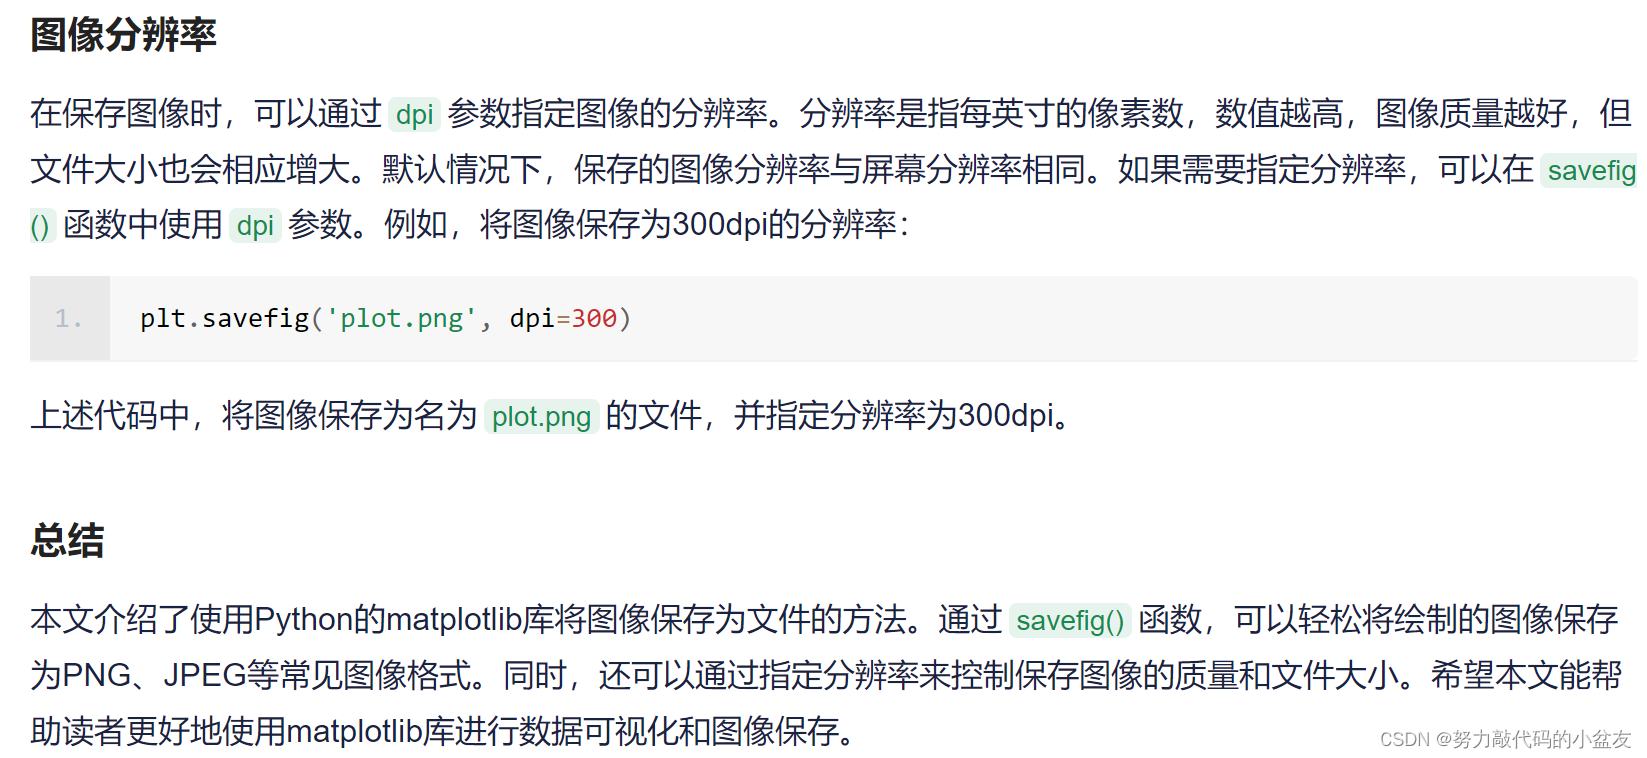
3.2 plt保存图片
此处参考此篇文章:python plt 保存图片
结束语
浅浅记录一下自己读懂预测代码并修改相应代码以达到使用自己训练的权重进行预测+预测整个文件夹的图片+保存画好框的图片+保存每个图片的标注框相应信息的txt文件的目的;并且过程中遇到的bug和tips。
更多推荐
 27
27 0
0- 0


 已为社区贡献6条内容

所有评论(0)